Computer Graphics
Computer Graphics is a field used extensively in games, movies and applications. Even this text right here is drawn via a computer graphics algorithm executed in the GPU and sent to your screen. All the computer games you play and movies you watch nowadays use a lot of computer graphics. We can talk about realistic wet surface illumination and reflection; motion blur in a racing game; a large procedurally generated orc army in an epic movie etc.
We can also talk about computer generated art; CAD software in engineering; data visualization; or even simulations.
Introduction
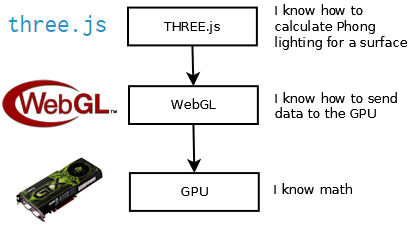
Because computers understand math, we need to specify our graphics in the language of math. There are many levels of computer graphics software and API-s. On the most bottom level, we of course have some machine commands that the GPU executes. Because there are different GPU manufactures, the direct commands vary. Also programming at the most lowest level is very time consuming and no one does that. That is why we have middleware like WebGL, OpenGL and DirectX that expose and wrap the graphics related calls. There are even more libraries built on top of those middleware API-s. The higher level libraries allow us to easily use specific algorithms and methods that the GPU actually is not supposed to know. For example in a scene with a cube and a light source, the GPU will have no idea how to calculate the light intensities on that cube. Thus GPU API-s like OpenGL should also not be responsible for doing that. Higher level libraries like THREE.js have some common methods for doing it implemented though, so the programmer does not have to rewrite the most used methods.
We can also move to the most highest levels of 3D modelling software and game engines. There usually exists some renderer that already knows what algorithms to execute when you want the GPU to draw (render) some specific thing. Because there are a lot of algorithms, there are a lot of parameters and methods to use. Of course everything also depends on your input data (assets). For example you might want to have an approximation of a sphere with 3 layers of semi-transparent textures, a corresponding normal map for more a granular surface illusion and some curved movement of that sphere in time.
Technologies
The are many ways to program graphics in a computer. As introduced previously, we can have different layers that utilize some graphics algorithms underneath. For example if we tell a Java application to draw a button, it will at some point tell the GPU the different colors and borderlines to draw. Even the text will be converted into lines and curves that are then converted to pixels on our screen.
In this course we will look at two approaches in two somewhat different environments.
C++ Program
Large number of computation heavy software uses C++ as a choice of language for the critical parts. That is because C++ is compiled into machine code and often optimized intensively in the process. Although C++ might not be the easiest or the fastest language for the actual implementation, it has imperative and object-oriented features. This means that knowing another imperative language, it is easy to follow the code execution of a C++ program. It is also a general purpose language so you can do pretty much anything with just C++.
For 2D graphics we will be using the Allegro game development library. Because graphics are usually an important part of games, Allegro is suited with different graphics programming features that allow easy implementation of graphic algorithms.
For 3D graphics OpenGL is a choice of middleware. Reasons here are the active use, development, popularity and extensive documentation of it.
JavaScript Program
For some reasons it might be more beneficial to do graphics on a web page. This approach has been gaining popularity in the recent several years now with the rise of WebGL. Initially JavaScript was meant to provide a more dynamic web page without the need to interact with the web server all the time. Together with HTML, the server provided a JavaScript code that changed the web page according to user activity. Soon there came a need to render an image on the client's side based on some data sent from the server (or even the client itself). There were several ways how people tried to do this, but ultimately HTML5 provided a standardized canvas element for such purposes. HTML5 was officially released in 28th October 2014, but major browsers had implemented features of it for a long time before that.
We can implement 2D graphics by directly drawing on the canvas element with JavaScript.
For 3D graphics we can use WebGL, which is based on OpenGL ES 2.0 (Embedded Systems). There is also a library THREE.js built on top of that, which provides an higher level of functionality.
Related Math
We will be introducing most of the related math when it is needed. Computer graphics uses concepts from geometry, linear algebra, calculus and other fields, so this is a good course to brush up on those fields.
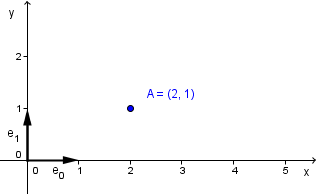
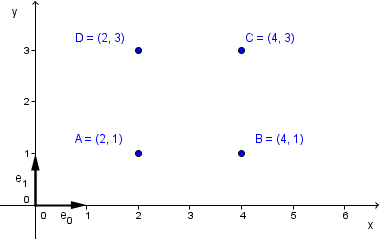
For a warm up, let us remember the vector spaces. One main example of it is the Euclidean space with Cartesian coordinates. This is the same thing you probably learnt in high school, where you drew a coordinate system with x and y axes, an origin point and an even spacing of numbers on both of the axes. Then you can draw a point on it and that point will be represented by an corresponding x and y coordinate.
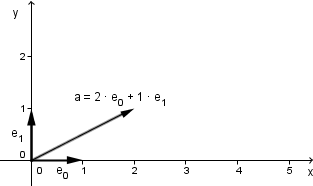
This is actually a vector space with basis vectors $e_0 = (1, 0)$ and $e_1 = (0, 1)$. The coordinates of our points define a certain linear combination of those vectors. Point $A$ has the coordinates $(2, 1)$. This means that this point $A$ is defined by $2 \cdot e_0 + 1 \cdot e_1$.
But wait, does not such a linear combination give us a vector? On the other hand we just said that A is a point?
You are right. The notion of vectors and points might sometimes be confusing. If we are talking about a vector space then there are the elements inside that vector space, that are sometimes called vectors. This is because the elements can be defined by a series of coordinates (coefficients of the basis elements / vectors), thus we get a vector with its coordinates.
So in that regard the point A is actually just another vector and it might be more correct to draw it as such. This is called a location or position vector, because it shows the location of our element in our space.
Although if we want to depict many elements, there will be many vectors originating from the origin and the drawing would be rather messy. If we want to depict individual elements in the space, it is more easy and understandable to draw them as points and have the coefficients be their coordinates.
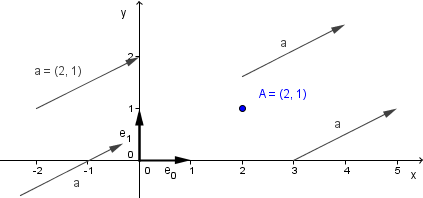
So are vectors then just something that are equivalent to points, but we hide them because of aesthetic reasons? No. In geometry we do talk about vectors, but by vectors we actually mean direction vectors. These are somewhat different things than the position vectors. They define a direction, not a position. You can think about them as elements from a different vector space, that has the same basis vectors, but where origins are not aligned. In fact these direction vectors do not even have an origin, they are everywhere at once.
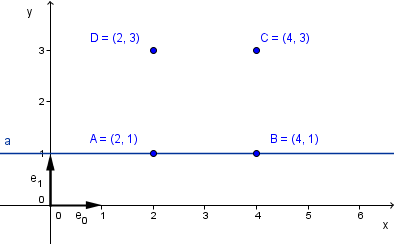
We can represent those vectors the same way we represented our point: by giving their coordinates in regard to the basis. But we do have to remember that they are indicating a direction, not a position. For example they might be indicating that there is light shining in the direction $(2, 1)$. This would mean that all of the points will be illuminated from roughly the south-west.
Ok, we can have some points that define locations in our space, and some vectors that define directional values. What about a square? Can we somehow define a square?
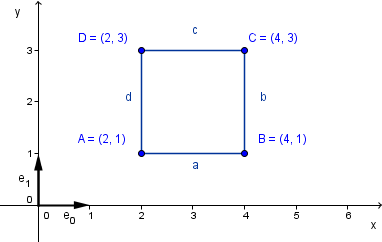
Let us try. First we need 4 points that will be the vertices of our square.
Well, can you see the square yet? Probably you can imagine, but currently the computer only knows that we have 4 distinct locations. It has no idea what those locations stand for.
For a square we would need to join them somehow. So, what would be the bottom edge of the cube? It would have to start from point A and end in point B. It should consist of all the points in between A and B.
You might remember, that the basis vectors in a vector space allow you to represent any element in that space. Representation is a linear combination of the basis vectors. Also all linear combinations of the basis vectors will give an element in the space.
With that in mind, what if we would try to represent the bottom edge somehow as a combination of points A and B. It can not be just a linear combination of the location vectors of those points - that would give us the whole vector space. But maybe we can bound the coefficients so that we can just get the edge?
We noticed that it should start with A, so in that place the coefficient for A should be 1 and the coefficient for B should be 0. Similarly it is true for the end point, which should be: $0 \cdot A + 1 \cdot B$.
So here is an idea, that if the second coefficient is 1 minus the first coefficient?
$edge = coefficient \cdot A + (1 - coefficient) \cdot B$.
If we allow the value for the $coefficient$ to have any scalar (real) value now, the result will be a line going through the points A and B.
This is not quite what we wanted, but we are actually really close. The line outside of the segment $[A, B]$ is when for example the coefficient is 2. Then the formula is:
$2 \cdot A - 1 \cdot B = 2 \cdot (2, 1) - (4, 1) = (4, 2) - (4, 1) = (0, 1)$
It is actually easy to see that if we take the endpoints ($coefficient = 0$ and $coefficient = 1$), and just keep the value of the $coefficient$ to be in that range $[0, 1]$, then we get only the segment between points A and B.
This would satisfy two important properties:
- All of the coefficients will be non-negative
- Sum of the coefficients will be 1
If these two properties are satisfied, then we have a thing called convex combination.
The same formula we can use for other segments as well, just taking the points B and C; C and D; D and A as the endpoints.
It is easy to see how the formula above will give us a line segment, so why do we need some special properties and a term for it?
Well, the convex combination can be for an arbitrary number of points. We have currently some form of a square here that we got via finding the line segments between the points. What about the inner area of the square? Is it a transparent square with only a border? Or should it perhaps be filled?
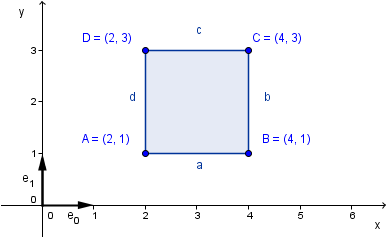
If we were to try to fill the square, we could take a convex combination of all 4 points.
$square = coef_1 \cdot A + coef_2 \cdot B + coef_3 \cdot C + coef_4 \cdot D$
All possible values (that satisfy the convex combination properties) of those coefficients in that formula would give us the whole filled square. We could also call it a convex hull of those 4 points. This means that all the points inside the square can be represented via a convex combinations of the vertices.
These were some basic ideas and thoughts that might come in handy as we proceed. It is often that we will try to interpolate between some values in order to get the values in between. Like here we wanted to get all the values that were somehow between the 4 points A, B, C and D.
Also, we should remember what we mean by a vector and a point. We saw that the representations for both are identical, although they mean different things. Later we will see that those representations will not stay identical and change according to properties that we would expect to differ for vectors and points.
For example, it would be nice if we could move a point. For example 1 unit right on the x-axis. So point $(2, 1)$ would become $(3, 1)$. But we do not want to move a vector. Vector $(2, 1)$ should stay $(2, 1)$. We will see how this can be done using a single operation.